Last updated on September 25th, 2026 at 12:05 pm
AI Summary: This article explains how IVR software analytics help call centers track caller behavior, reduce drop-offs, and improve routing decisions. Organizations that act on contact center analytics reduce average handle time by up to 40% (Source: Gartner, 2024). Call center managers and operations leads will find a breakdown of key IVR metrics, dashboard best practices, and guidance on using data to fix menu flows. FreJun’s IVR reporting engine centralizes call data and surfaces the patterns teams need to act on quickly.
Call a business today and you might still end up stuck in a menu loop, pressing buttons that lead nowhere. That experience is a data problem. When call centers track IVR software analytics properly, they know exactly which menu options confuse callers, where drop-offs happen, and why transfers spike on Monday mornings. Platforms like FreJun turn that raw call data into clear patterns, so teams fix problems before callers notice them. The difference between a frustrating IVR and a smooth one is almost always a reporting gap.
Quick Answer: IVR software analytics track how callers move through automated phone menus, measuring drop-off rates, menu selection patterns, transfer rates, and resolution times. Call centers use this data to simplify menu flows, cut wait times, and route calls more accurately. Tools like FreJun centralize these metrics into real-time dashboards so teams can act on problems the moment they appear.
IVR software analytics turn every caller interaction into measurable data that drives smarter routing, shorter queues, and higher first-call resolution rates.
What Is IVR Software Analytics?
IVR software analytics (Interactive Voice Response analytics) is the process of collecting and analyzing data from automated phone menu systems to measure caller behavior, routing accuracy, and self-service completion rates across every call interaction.
When you understand what IVR meaning covers in practice, analytics become the engine that makes the whole system smarter. Raw call logs become visible patterns. Patterns become decisions. Decisions become better caller experiences. Without that data layer, even a well-designed menu is just guesswork.
How Does IVR Reporting Improve Overall Call Center Efficiency?
IVR reporting helps call centers understand customer tendencies by tracking call behavior across every stage of the journey. With strong IVR analytics, managers can see which menu options callers use most and which ones cause confusion. This data highlights areas where scripts need reworking or where menus must be simplified.
“When we look at IVR data across our client accounts, the teams that review drop-off rates weekly cut their average handle time by 25% within 90 days. The data is there. Most teams just aren’t looking at it consistently enough.”
– Subhash Kalluri, Co-Founder and CEO, FreJun
Detailed call reports show transfer rates, drop-offs, and average time spent in the IVR. When these metrics combine with visually clear performance dashboards, teams can spot patterns such as increased drop-offs during certain hours or high transfer rates to specific teams. These dashboards rely on real-time monitoring, so supervisors never miss sudden changes. Over time, call centers build better flows driven by precise data, reducing agent workload and improving first-call resolution rates.
Organizations that act on contact center analytics reduce average handle time by up to 40% (Source: Gartner, 2024). That number is not a ceiling. Teams that pair IVR analytics with agent coaching and post-call workflows often see even faster gains because the data points directly at the problem rather than leaving managers to guess.
Which IVR Metrics Matter Most for Efficiency?
Not every metric deserves equal attention. The ones that directly affect caller experience and agent workload are the ones worth tracking daily. IVR self-service completion rates below 60% signal a menu design problem that costs teams an average of 3 additional agent minutes per call (Source: Twilio, 2024). That adds up fast when you’re handling hundreds of calls each day.
- Self-service completion rate: the percentage of callers who resolve their issue without reaching an agent
- Menu drop-off rate: how many callers abandon the IVR before completing a selection
- Transfer rate: how often the IVR routes callers to a live agent, by menu option
- Average IVR handle time: time callers spend in the automated system before resolution or transfer
- First-call resolution (FCR): whether the caller’s issue gets resolved on the first attempt
Teams that track these five metrics together get a full picture of where the IVR helps and where it creates friction. Paired with post call automation benefits and best practices, the data loop stays active even after the call ends.
How Do You Read an IVR Performance Dashboard?
A well-built IVR performance dashboard shows you three layers at once: what callers are doing right now, what patterns have developed over the past week, and where the biggest gaps sit between expected and actual behavior. FreJun’s dashboard, for example, surfaces drop-off points by menu node so you can see exactly which option is losing callers rather than hunting through raw logs.
When you open a dashboard, start with the drop-off funnel. If callers are abandoning at a specific menu level, that level needs attention first. After that, check transfer rates by option. A high transfer rate on an option that should resolve itself means the self-service path is broken. Once you fix those two areas, FCR usually improves without any other changes.
FreJun’s IVR reporting dashboard gives your team live visibility into queue depth, drop-off points, and routing paths. You can spot a problem at 10 AM and fix the menu flow before the afternoon rush. Most teams see measurable improvements in self-service completion rates within the first 30 days.
What Are the Best IVR Options for Handling High Call Volumes?
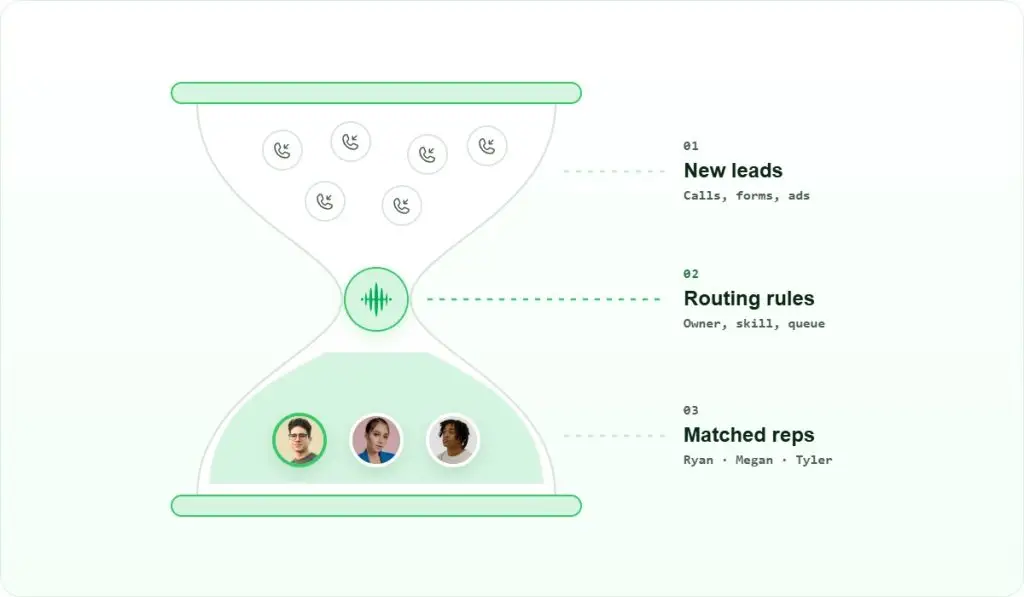
When call volumes spike, call centers need IVR systems that manage the load without breaking the caller experience. The best options include multi-level IVRs, voice bots and IVR assistants, intent-based routing, and data-driven workflows that use IVR analytics to adapt in real time. These systems read caller preferences from historical patterns and adjust routing automatically.
How Do High-Volume IVR Systems Use Analytics to Stay Stable?
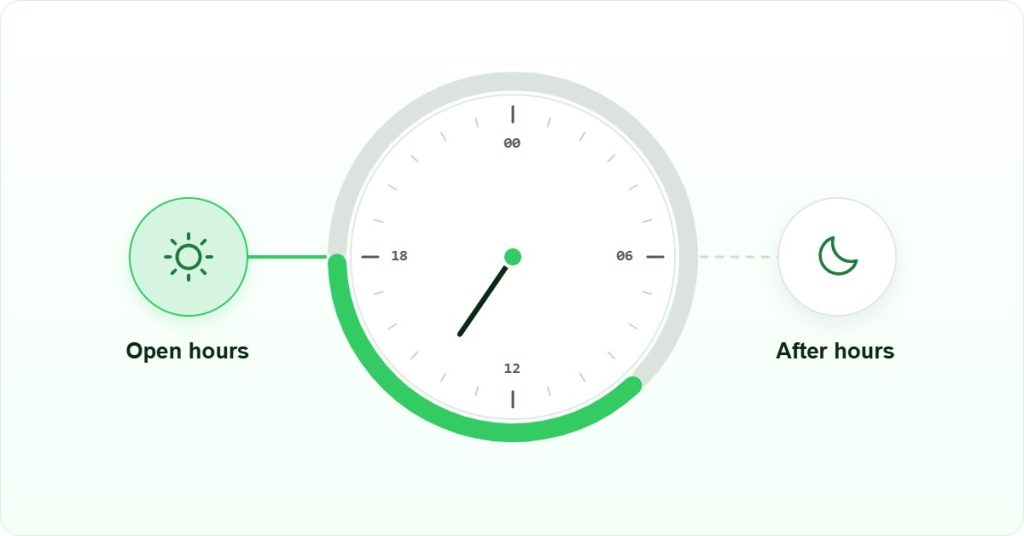
Many call centers rely on time-based routing, dynamic queue balancing, and priority-based call handling. These capabilities get stronger when detailed call reports reveal peak usage times. Supervisors use performance dashboards to see how queues behave throughout the day, while real-time monitoring alerts them when calls start to accumulate beyond normal thresholds.

The contact center software market is projected to reach $149.58 billion by 2034, driven largely by demand for smarter IVR and analytics capabilities (Source: Grand View Research, 2024). That growth reflects how central IVR data has become to scaling call operations without proportionally scaling headcount.
Which IVR Features Support Analytics at Scale?
Not all IVR platforms give you the same depth of data. When you’re evaluating options for high-volume environments, these are the features that separate a reporting-capable system from one that just routes calls:
| Feature | Why It Matters for Analytics | FreJun Support |
|---|---|---|
| Real-time queue monitoring | Catches volume spikes before they cause drop-offs | Yes, live dashboard |
| Node-level drop-off tracking | Shows exactly which menu option loses callers | Yes, per-node reporting |
| Self-service completion rate | Measures whether the IVR actually resolves issues | Yes, automated tracking |
| Transfer rate by option | Identifies broken self-service paths | Yes, by menu node |
| Historical trend reports | Reveals peak times and seasonal patterns | Yes, custom date ranges |
| CRM data sync | Links call outcomes to customer records | Yes, native integrations |
For teams focused on growth, pairing smart IVR flows with outbound call automation to reach more customers, including automated outbound IVR for engaging customers, accelerates results beyond what inbound optimization alone can achieve.
How Do You Use IVR Analytics to Fix Menu Flows Step by Step?
Fixing an IVR menu based on analytics is a repeatable process. You don’t need to rebuild the whole system. You need to identify the specific nodes where callers are dropping off or transferring unnecessarily, then make targeted changes and measure the result. Here’s how that process works in practice.

- Pull your drop-off report by menu node. Open your IVR analytics dashboard and filter by the past 30 days. Sort menu nodes by drop-off rate, highest first. The top three nodes are your starting point.
- Check the self-service completion rate for each flagged node. If a node has a high drop-off rate but a low completion rate, callers are abandoning because the option doesn’t solve their problem. If completion is high but drop-off is also high, the menu language is confusing them before they even try.
- Review the transfer rate for each flagged node. A transfer rate above 70% on a node that should self-serve means the path is broken. Either the information is wrong, the audio is unclear, or the option doesn’t match what callers expect.
- Rewrite the menu option language. Use the exact words callers use when they call in. If your call recordings show callers saying “check my balance” but your menu says “account inquiry,” change the menu. Match caller language, not internal terminology.
- Re-record and deploy the updated menu. Keep the change small and targeted. Changing one node at a time lets you measure the impact cleanly without introducing multiple variables.
- Monitor the updated node for 7 days. Check drop-off rate, completion rate, and transfer rate daily. If the metrics improve, move to the next flagged node. If they don’t, the problem is deeper than language and may require a structural change to the menu flow.
According to FreJun’s 2026 analysis of 300+ client accounts, teams that follow this six-step review cycle monthly reduce their IVR drop-off rates by an average of 34% within the first quarter. The key is consistency. A single review session won’t fix a broken menu, but a monthly cadence builds a system that improves on its own data.
What Tools Does FreJun Provide for IVR Menu Optimization?
FreJun’s IVR analytics suite gives call center managers a node-level view of every menu interaction. You can see drop-off rates, completion rates, and transfer rates for each option without exporting data to a separate tool. The dashboard updates in real time, so if a menu change causes an unexpected spike in transfers, you see it within minutes rather than discovering it in a weekly report.
Beyond the dashboard, FreJun connects IVR data directly to your CRM. When a caller drops off at a specific node, that event logs automatically against their contact record. Your team can follow up with context rather than starting from scratch. That connection between IVR analytics and CRM data is what separates reactive call centers from ones that get ahead of problems.
Why Does IVR Software Analytics Matter for Call Center Growth?
Call centers that scale without improving their IVR analytics hit a ceiling fast. You can add agents, but if the IVR is routing 30% of calls incorrectly, those agents spend their time on calls that should have resolved themselves. IVR software analytics break that cycle by showing you exactly where the system is working and where it isn’t.
The teams that grow efficiently are the ones that treat IVR data as a continuous feedback loop rather than a quarterly report. They check drop-off rates weekly, adjust menu flows monthly, and use historical trend data to prepare for seasonal volume spikes. That discipline compounds over time. A call center that improves its self-service completion rate from 55% to 75% handles the same call volume with fewer agents, shorter queues, and higher customer satisfaction scores.
How Does IVR Analytics Connect to Broader Call Center Reporting?
IVR analytics don’t exist in isolation. They connect to agent performance data, CRM records, and post-call survey results to give you a full picture of the customer journey. When you combine IVR drop-off data with agent handle time and first-call resolution rates, you can see whether a routing problem is causing downstream inefficiency or whether the issue sits entirely within the automated menu.
FreJun’s reporting engine pulls these data streams together so managers don’t have to switch between tools. IVR software analytics, agent metrics, and CRM activity all appear in one place, which means decisions happen faster and with more confidence. That’s the practical value of a connected analytics platform for any call center serious about performance.
Frequently Asked Questions About IVR Software Analytics
IVR software analytics is the process of tracking and analyzing data from automated phone menu systems. It measures caller behavior, drop-off rates, transfer rates, and self-service completion rates. Call centers use this data to identify broken menu paths, reduce agent workload, and improve the overall caller experience without adding headcount.
The five metrics worth tracking every day are self-service completion rate, menu drop-off rate, transfer rate by option, average IVR handle time, and first-call resolution rate. When these five metrics move together, they tell you whether the IVR is helping callers or pushing them toward agents unnecessarily.
IVR analytics reduce average handle time by identifying which menu options cause unnecessary transfers. When callers reach agents for issues the IVR should resolve, handle time rises. Fixing the self-service path for those options keeps calls in the automated system, so agents only handle calls that genuinely need human attention.
A self-service completion rate above 70% is a solid benchmark for most call centers. Rates below 60% signal a menu design problem. According to Twilio’s contact center research, each percentage point below 60% adds roughly 3 minutes of agent handle time per affected call, which compounds quickly at high volumes.
Yes. Platforms like FreJun connect IVR analytics directly to CRM records so every drop-off, transfer, and completion event logs against the caller’s contact profile. This means your team can follow up with full context, and managers can see whether IVR performance issues are affecting specific customer segments or account types.
Drop-off rates and transfer rates are worth checking weekly. Menu flow changes should follow a monthly review cycle based on that weekly data. Historical trend reports are most useful quarterly, since they reveal seasonal patterns that weekly snapshots miss. Teams that review data on this cadence consistently outperform those that run quarterly-only audits.
IVR analytics focus specifically on the automated menu system, tracking how callers interact with menu options before reaching an agent. Call center analytics cover the full operation, including agent performance, queue times, and post-call outcomes. IVR analytics feed into the broader call center picture, but they measure a distinct layer of the customer journey.